
BUSTING MYTHS: INDIAN MARKETS AT 22 P/E?
Despite the recent rally, the consensus bullish narrative on India is that “Indian markets are not overly expensive. Headline P/Es for the Nifty 50 & other benchmarks still look reasonable relative to history and global peers.”

But the real question you need to ask yourself is:
Aequitas’ bottom-up screening across the Nifty 50, Nifty Midcap 150, Nifty LargeMidcap 250, and Nifty 500 reveals a very different story:
- Index valuations are being artificially muted by a handful of low-multiple PSUs and financials.
- Once we strip out PSUs and Banks/NBFCs/Insurance, the core corporate universe trades at 40–45x median P/E, with a very long tail well above 50x.
- 84 of these stocks (as of 10th Dec 2025) are quoting at 52-week lows, down 45% on an average from their peaks. Even after such deep corrections, they still trade at ~29x P/E on average.
- Market breadth is deteriorating: in the mid-cap and large-midcap segments, nearly half the stocks have negative 1-year returns, even as the indices hover near their 52-week highs.
Taken together, these data points suggest bubble-like conditions in Indian equities – not a benign re-rating.
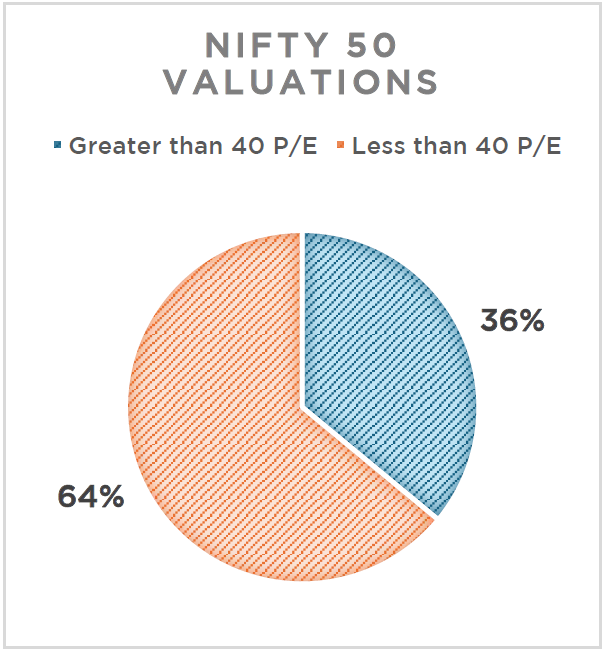
1. Nifty 50 – Valuations masked by a handful of PSUs.
Headline Nifty valuations appear “reasonable” primarily because low multiple PSUs and a few large financials pull down the index P/E. Let’s understand through numbers:
2. Nifty Midcap 150: Overvalued and How!
While Nifty looks expensive, the Midcap 150 is the clearest warning signal. And for most investors, mid- and small-cap exposure is far higher than large caps — in pursuit of higher returns.


Again, once we remove the optically cheap PSUs and financials, the core large–mid universe trades at 40–50x+ earnings for most stocks.
Growth and returns (ex-PSUs/Banks/NBFCs):
- 28% of companies have negative profit growth QoQ.
- 42% have profit growth below 10% or negative.
- 45% of stocks have negative 1-year returns.
- 63% have 1-year returns below 10% or negative.

4. Nifty 500: The Broader Market Is Also Stretched
The Nifty 500 confirms that this is not just a midcap or one-off sector story.


Profit growth in the core universe is also uninspiring:
- 32% of the ex-PSU/financial companies have negative profit growth
- 44% have profit growth below 10% or negative.
Analyst comments on the broader data mirrors this weakness:
- Around 44% of Nifty 500 companies have negative 1-year returns,
- About 62% have 1-year returns below 10% or negative.
Why We Believe the Valuations are stretched?
Across all four indices, three patterns are consistent:
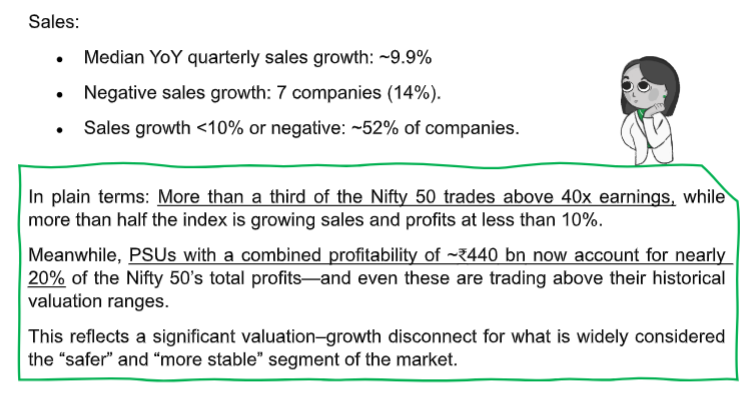
1. Valuations are extreme once PSUs and financials are excluded.
- Median P/E across the core universe (ex-PSU, ex-Banks/NBFCs) clusters in the low- to mid-40s.
- Average P/E is close to 70x, reflecting a long tail of very expensive names.
- In many segments, 40–60% of stocks trade above 40x–50x earnings.
2. Earnings Growth does not justify these multiples.
- Roughly 35% of non-PSU, non-financial companies reported negative profit growth in the latest quarter.
- Around 45% are growing profits at less than 10% or shrinking.
- Yet, these businesses continue to trade at growth-stock valuations of 40x–50x+, despite deteriorating fundamentals.
3. Market Breadth is poor despite indices at or near highs.
- In the Midcap 150 and Large Midcap 250, ~45–50% of stocks have negative 1-year returns, and ~60%+ have returns below 10% or negative.
- Indices continue making new highs, but most constituents are not participating in the rally.
- Analysing some of the largest Mutual funds, the average holdings of PSUs are less than 15%.
Conclusion
This is not a picture of a broad, earnings-led bull market. It is a market where:
- Prices and valuations have run ahead of fundamentals,
- Leadership is narrow, and
- The apparent comfort at the index level is largely an optical illusion created by cheap PSUs and select financials masking high valuations elsewhere.

Lesson from History:
Whenever investors have paid elevated valuations, long-term returns have tended to be suboptimal.
Disclaimer: The above content is for knowledge purpose only and under no circumstances is the information therein to be used or considered as constituting an offer to buy or sell, or solicitation of any offer to buy or sell or recommendation to acquire or dispose of any security, commodity or investment or to engage in any other transaction.